
An Electrocardiogram (ECG) helps healthcare professionals assess the heart’s rhythm and detect any abnormalities that may indicate cardiovascular issues. It is a common component of healthcare simulation scenarios. Healthcare educators must have at least some information about what the waves on an ECG graph mean.
Reading the PQRST Waves
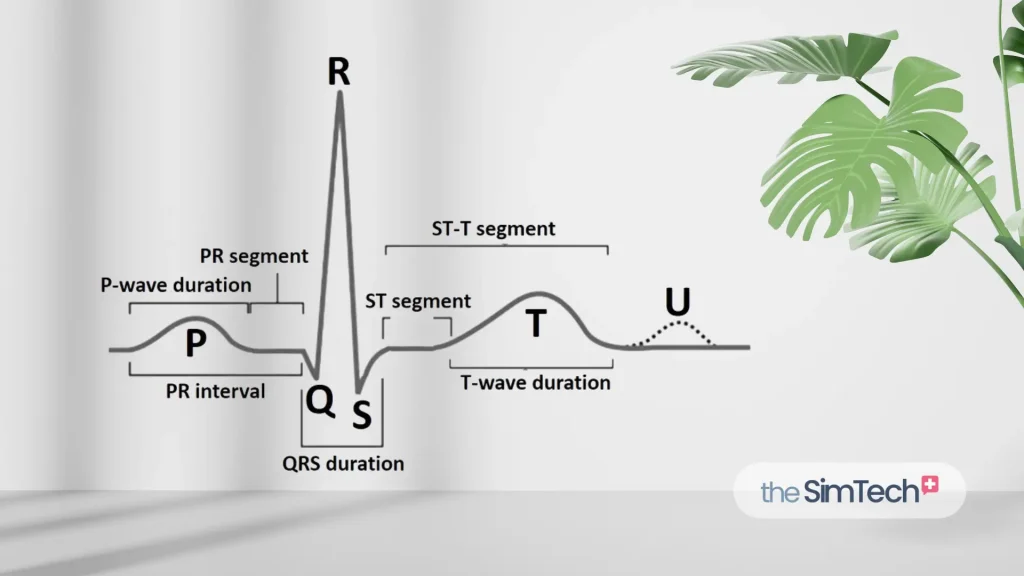
The PQRST waves on an ECG represent different phases of the cardiac cycle. The P wave indicates atrial depolarization, the QRS complex signifies ventricular depolarization, and the T wave represents ventricular repolarization. Analyzing these waves helps identify irregularities in heart function.
Standard 12-Lead ECG Placement
The standard 12-lead ECG placement involves positioning electrodes on specific areas of the patient’s body to capture electrical signals from the heart in different planes. Electrode placement on the limbs and chest follows a standardized protocol, ensuring consistency across ECG recordings.
Initial Assessment and Overview

The first step in interpreting ECG images is to perform an initial assessment to gather information about the patient’s heart activity. This includes analyzing the rate, rhythm, and overall morphology of the ECG waves. The overview allows you to establish a baseline understanding before delving into more specific details.
Identifying Rhythm Patterns
Identifying rhythm patterns involves examining the regularity of the heartbeats on the ECG tracing. Common rhythm patterns include sinus rhythm, atrial fibrillation, and ventricular tachycardia. By analyzing the intervals between QRS complexes, you can determine if the rhythm is regular or irregular, providing crucial insights into the heart’s electrical activity.
Evaluating Heart Rate and Rhythm

Evaluating the heart rate involves calculating the number of QRS complexes within a specific time frame, usually a minute. This allows you to determine if the heart rate is within normal limits or if it falls into categories like bradycardia or tachycardia. Understanding the relationship between heart rate and rhythm is essential for accurate ECG interpretation.
Axis Determination
Axis determination is crucial in ECG interpretation, providing insights into the heart’s orientation and electrical activity. By analyzing the QRS complex in specific leads, you can determine the heart’s electrical axis, which can reveal abnormalities such as left axis deviation or right axis deviation. Understanding the heart’s axis helps in diagnosing conditions like ventricular hypertrophy.
Identifying Pathological Patterns
Identifying pathological patterns involves recognizing abnormal changes in the ECG waveform that indicate underlying heart conditions. This includes patterns like ST-segment elevation, T-wave inversion, and Q waves, which can signify myocardial infarction, ischemia, or other cardiac abnormalities. By detecting these patterns, healthcare educators can guide medical professionals in accurate diagnosis and timely intervention.
In conclusion, mastering the interpretation of ECG images is a valuable skill for healthcare educators, enabling them to teach accurate diagnosis and monitoring of cardiac conditions. By following a step-by-step approach, from initial assessment to advanced interpretation techniques, educators can enhance their expertise and effectively convey essential knowledge to medical professionals. Continual practice and staying updated with the latest guidelines are key to becoming proficient in ECG interpretation and improving patient outcomes.
Normal Sinus Rhythm
Normal ECG patterns serve as a baseline for comparison when analyzing cardiac rhythms. A normal sinus rhythm demonstrates regular P waves, followed by QRS complexes and T waves, reflecting the electrical activity of the heart in a healthy individual. Look for:
- Consistent P wave preceding each QRS complex
- Regular heart rate between 60-100 beats per minute
- Normal PR interval (0.12-0.20 seconds) and QRS duration (0.06-0.10 seconds)
- Upright T waves, indicating repolarization of the ventricles
Atrial and Ventricular Arrhythmias
- Atrial Fibrillation: Irregularly irregular R-R intervals with absent P waves
- Ventricular Tachycardia: Wide QRS complexes with heart rate >100 beats per minute
- Ventricular Fibrillation: Chaotic electrical activity, presenting as a fine or coarse ventricular fibrillation
Myocardial Infarction Patterns
- ST-Segment Elevation: Characteristic elevation of the ST segment indicating acute myocardial injury
- T-wave Inversion: Inverted T waves following an acute coronary event, signifying myocardial ischemia
- Pathological Q Waves: Deep, wide Q waves in specific leads, suggesting prior myocardial infarction
Symptomatic Analysis
Conducting a symptomatic analysis involves integrating patients’ complaints, medical history, and ECG results to form a comprehensive diagnostic picture. Healthcare educators must adeptly navigate through a myriad of symptoms to identify potential cardiac implications reflected in ECG recordings. This skill ensures a holistic approach to patient care, optimizing clinical outcomes.
Teaching ECG Interpretation to Healthcare Educators
Electrocardiogram (ECG) interpretation is a critical part of professional development. By understanding the principles of ECG analysis, educators can impart this knowledge effectively to their students. It is essential to emphasize the importance of recognizing normal ECG patterns, identifying abnormalities, and interpreting rhythm disturbances accurately. Incorporating case studies and real-life scenarios can enhance the practical application of ECG interpretation skills among educators, enabling them to better prepare healthcare professionals for real-world clinical settings.
Developing a robust curriculum for teaching ECG interpretation requires a systematic approach. The curriculum should cover basic concepts such as ECG lead placement, waveform analysis, and arrhythmia recognition. Integrating hands-on practice sessions, workshops, and interactive discussions can deepen educators’ understanding and proficiency in teaching ECG interpretation. Additionally, incorporating continuous assessment and feedback mechanisms can help educators track progress.
Common Challenges in ECG Interpretation
Interpreting ECG images can present various challenges, especially for beginners. Some common difficulties include identifying specific waveforms accurately, distinguishing between normal and abnormal rhythms, and recognizing artifacts that may distort the recording. Additionally, understanding the significance of subtle changes in the ECG tracing, such as ST-segment deviations or T-wave abnormalities, can be complex for those new to interpreting ECGs.
ECG Interpretation Courses
Accredited programs such as the ECG Certification offered by the American Board of Cardiovascular Medicine provide structured training on ECG analysis, rhythm recognition, and interpretation of cardiac arrhythmias. Online platforms like MedMastery, Coursera, or Khan Academy offer free courses covering fundamental concepts of electrocardiography. Continuous medical education (CME) programs focused on ECG interpretation updates and workshops led by experienced cardiologists can also supplement learning and skill development in this field.
EKG/ECG Images Free Download
A database of EKG/ECG images is available on the EKG/ECG Images Database page.
Explore other resources:
- MEDICAL SIMULATION SCENARIOS
- IMAGE/AUDIO/VIDEO DATABASES
- MEDICAL MOULAGE
- SIM CENTER RESOURCES
- LINKS
- CONTACT
- BLOG
- Privacy Policy
Warning: include(theme_templates/standard/business1.php): Failed to open stream: No such file or directory in /home/globalpu/domains/thesimtech.org/public_html/wp-content/plugins/starboxnew/view/Themes/themes_render.php on line 28
Warning: include(theme_templates/standard/business1.php): Failed to open stream: No such file or directory in /home/globalpu/domains/thesimtech.org/public_html/wp-content/plugins/starboxnew/view/Themes/themes_render.php on line 28
Warning: include(): Failed opening ‘theme_templates/standard/business1.php’ for inclusion (include_path=’.:/usr/local/php81/lib/php’) in /home/globalpu/domains/thesimtech.org/public_html/wp-content/plugins/starboxnew/view/Themes/themes_render.php on line 28